Social protection can safeguard access to productivity-boosting opportunities
Selahattin Selsah Pasali1 & Ermina Sokou2
More than reducing poverty and income inequality, social protection safeguards access to basic opportunities across the life cycle, particularly in times of need. When a household is protected through a social protection scheme, potential loss of income from unemployment, maternity, disability, sickness or old age does not have to upend their standard of living.
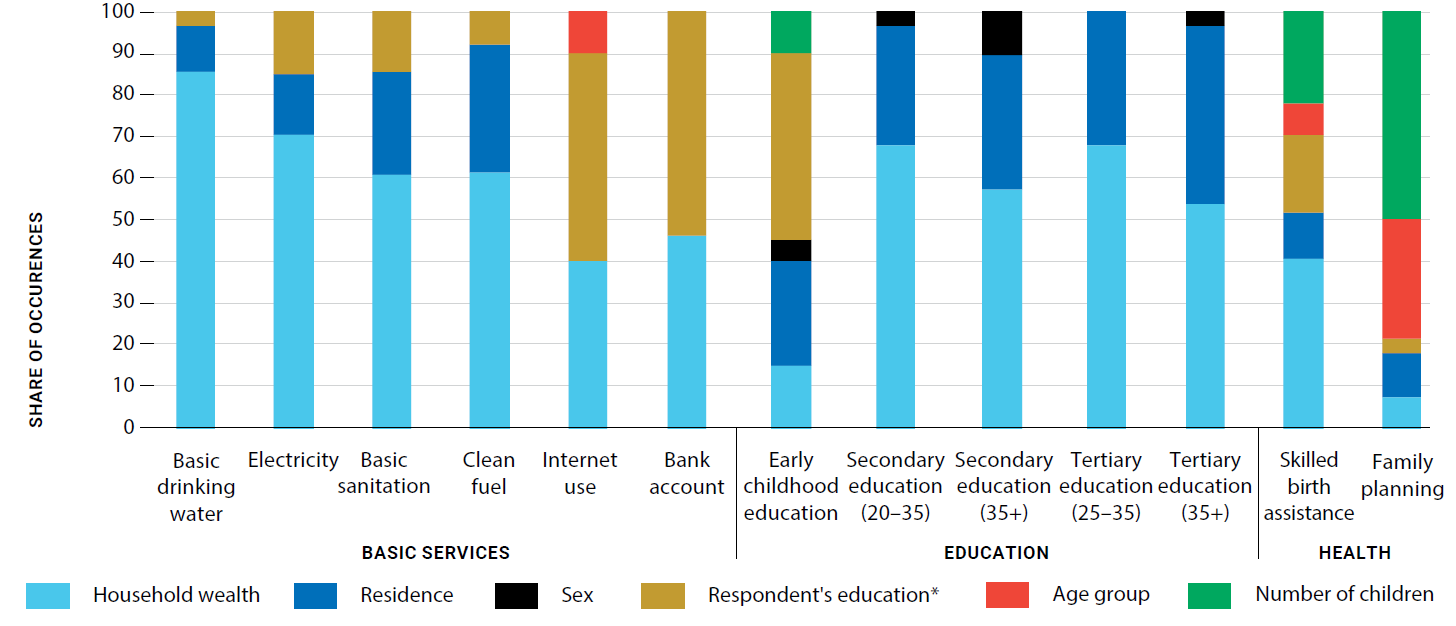
Households and individuals in the bottom 40 per cent of the wealth distribution across Asia and the Pacific have consistently lower access to basic opportunities (Figure 1). As a driving force behind most inequalities, wealth is way ahead of other circumstances such as sex, residence, age and level of education.
Figure 1. The most important circumstances that reduce access to basic opportunities
Source:ESCAP calculations based on LNOB analysis and using data from the latest DHS and
MICS surveys for 28 countries in the Asia-Pacific region. For more information, visit
https://lnob.unescap.org
Note:Figure 4.5 shows the share of occurrences where a specific circumstance such as
household wealth contributed the most to inequality, based on a calculated measure of variable importance of
the model. The higher the share, the more times this specific circumstance is responsible for the gaps in access
to an opportunity. For most indicators, results pertain to 26–28 countries. In early childhood education and
internet use, the bars reflect data from 20 countries. *Education is both a desired outcome or opportunity,
depicted here as Secondary education (ages 20–35) and Higher education (ages 25–35), and a circumstance,
shaping groups’ access to other opportunities or experience of barriers. Respondent’s education as a circumstance is
not used in analyzing gaps in education as an opportunity.
If families’ economic or financial situation is this important, how could a potential social protection transfer such as a universal child benefit help safeguard access to opportunities? This thought-provoking question was inspired by the ESCAP Leave No One Behind (LNOB) Platform which highlights inequalities in access to opportunities across 28 countries in Asia and the Pacific.
By providing a slight increase in income of 4% of GDP per capita to all households with children below the age of 18, we can simulate how access to several opportunities would improve (Table 1). Using nationally representative household surveys from Armenia, Cambodia, Kiribati, Mongolia and Türkiye, the positive impact of this social protection transfer is significant, particularly so for households with the lowest access rates.3
Table 1 Selected indicators and national social protection transfer amounts at 4% GDP per capita
| Armenia 2020 | Cambodia 2019/20 | Kiribati 2019 | Mongolia 2018 | Türkiye 2019 | |
|---|---|---|---|---|---|
| Benefit amount | AMD 7,300 or USD 14.5 per month | KHR 22,000 or USD 5.4 per month | AUD 8 or USD 5.8 per month | MNT 42,000 or USD 7.7 per month | TRY 240 or USD 16.3 per month |
| Indicator 1 | Bad dwelling conditions | Negative Coping: Reduce food or Sell assets | Clean Water | Savings Account | Warm Home |
| Indicator 2 | Satisfactory Health Services | Ever sleep hungry | Good Living Standards | Internet at Home | Make Ends Meet Easily |
| Indicator 3 | Clean Fuel | Clean Fuel | Clean Fuel | Clean Fuel | Clean Fuel |
Note:Some of these indicators are opportunities (e.g., access to internet and bank account), while others represent barriers (e.g., negative coping strategies). Conversion of local currency to USD is based on average exchange rates in February 2022.
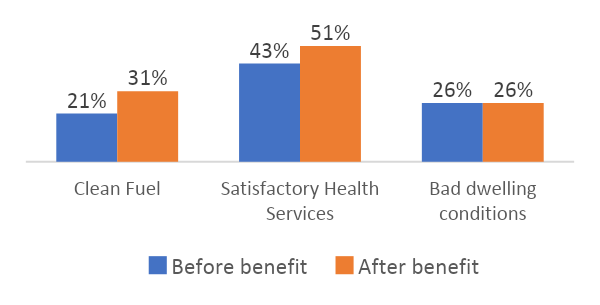
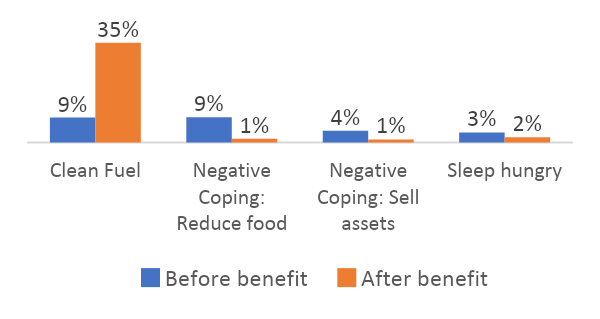
In Armenia, a monthly child benefit of 4% of GDP per capita would increase the furthest behind households’ access to clean fuels from 21 to 31% and their satisfaction with health services from 43 to 51% (Figure 2, Panel A). The transfer would, however, not improve their dwelling conditions, as the determining characteristic for this indicator is the education level of the household head, rather than income. In Cambodia, the corresponding transfer would boost access to clean fuels for cooking from a meagre 9 to 35%. Equally important is that the transfer would reduce a range of negative coping strategies that hamper prospects of households, particularly for children (Figure 2, Panel B). In Cambodia, around 3% of households reported having to reduce food intake in response to shocks. This prevalence increases threefold to 9% among furthest behind households. Thanks to the simulated child benefit, almost none of the furthest behind households with children would have to reduce food intake.
Figure 2. Impact of a monthly transfer of 4% of GDP per capita for furthest behind households in Armenia and Cambodia
Note:ESCAP analysis using Households’ Integrated Living Conditions Survey (2020) made publicly available by the Statistical Committee of the Republic of Armenia and Cambodia Socio-Economic Survey (2019-2020) which was made available by Cambodia National Statistical Institute.
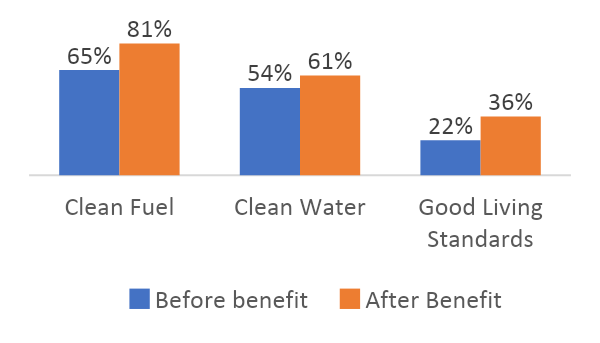
In Kiribati, simulated child benefit, would improve access to clean fuels among furthest behind households from 65 to 81% (Figure 3, Panel A). In this way, average access rate among furthest behind households would come much closer to the national average access rate of 87%. For clean water4, the furthest behind groups would also see an increase in access rates from 54 to 61%, but that would not be as significantly as in clean fuels. They would also remain well behind the national average rate of79%. Partly, this can be explained by the fact that household per capita income is a key driver of inequalities in access to clean fuels, while location of residence is a key driver of inequalities in access to clean water. Importantly, receiving the child benefit would also increase overall living conditions. In fact, after receiving the child benefit, 36% of the furthest behind would assess their living conditions as adequate, compared to only 22% prior to receiving the benefit.
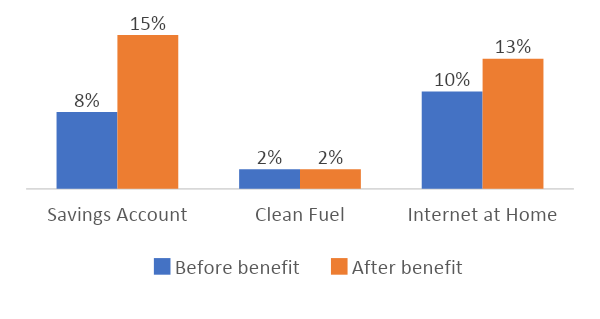
Figure 3. Impact of a monthly transfer of 4% of GDP per capita for furthest behind households in Kiribati and Mongolia
Note:ESCAP analysis using Cambodia Socio-economic survey (2019-2020) made available to ESCAP by Kiribati National Statistical Office via the Pacific Community (SPC) and using Mongolia Household Socio-Economic Survey (2018) made publicly available by Mongolia National Statistical Office.
Mongolia already has a universal and generous child benefit scheme i.e., the Child Money Programme, which was increased during the pandemic to MNT 100,000 corresponding to almost 10% of GDP per capita and is therefore more than double the global average for a child benefit. To be comparable with the other country examples, the simulation used a 4% GDP per capita transfer scenario, corresponding to MNT 42,000. This child benefit would almost double, from 8 to 15%, the share of furthest behind households with a savings account (Figure 3, Panel B). The impact would be smaller, but positive, in terms of accessing Internet at home, which would increase from 10 to 13% among the furthest behind groups. The one indicator where the transfer would not have any impact is access to clean fuels. The reason being that unequal access to this opportunity is driven by being in the rural area, which is where almost all furthest behind households are living. Other complementary interventions are therefore needed.
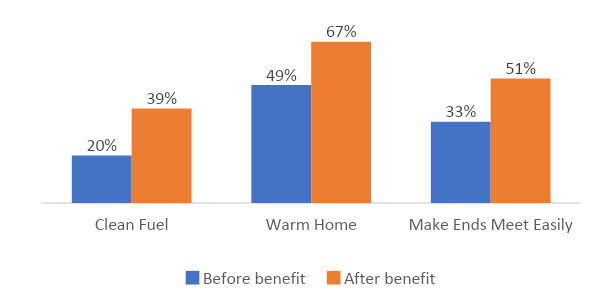
Figure 4. Impact of a monthly transfer of 4% of GDP per capita for furthest behind households in Türkiye
Note:ESCAP analysis using the Survey of Integrated Living Conditions (2019) which was made available by Turkish Statistical Institute.
Impacts would obviously increase dramatically for these and other opportunities across all four countries if the transfers would instead be, say 10% of GDP per capita, a level much more realistic if working-age people had access to decent jobs.
Last week, we launched this year’s Social Outlook for Asia and the Pacific: The Workforce We Need. The report found that even prior to the pandemic, half of all people in our region had already been surviving without cash, a third without necessary medicine or treatment, and a quarter had gone without enough food to eat. The pandemic worsened the situation significantly pushing over 240 million people into poverty across Asia and the Pacific5. In response, the report called for universal social protection. It highlighted that almost 70 per cent of all workers were excluded from contributory social protection schemes and argued for the integration of contributory and non-contributory schemes to provide all people with individual entitlements along the life cycle. It also emphasized the need for adapting social protection schemes to ageing societies and supporting them by digital technologies for efficiency and resilience.
Universal social protection is affordable and can help immensely in addressing poverty and inequality in Asia and the Pacific, but as this simulation exercise has shown, also in access to a range of other basic, but fundamental opportunities. The ESCAP’s Social Protection Simulator shows that a social protection package consisting of a universal child benefit, an old age pension and a disability benefit, set at global average benefit levels, would slash poverty in our region by half. This is on top of the additional benefit of improving access to opportunities shown above. The cost of doing so would mean increasing public spending by 2.5- 7.6% of GDP, an investment well-worth its cost. The Action Plan to Strengthen Regional Cooperation on Social Protection in Asia and the Pacific can guide action towards broadening social protection coverage in Asia and the Pacific.
1Social Affairs Officer, Socioeconomic Transformation Section, Social Development
Division, United Nations ESCAP
2Programme Officer, European Commission.
3For technical information on the simulation, see technical appendix to the
Social Outlook for Asia and the Pacific: The Workforce We Need available at https://socialoutlook.unescap.org/
4Evaluating an unconditional child benefit in Nepal through
quasi-experimental
research design, Renzaho et al. (2018) found that the proportion of households that reported
drinking water from unimproved sources, which had unimproved sanitation facilities and that
practices unsanitary disposal of waste reduced significantly among treatment households.
Concomitantly, child transfers reduced stunting, underweight and wasting among children
significantly. The positive relationship between child benefits and improved access to sanitation
was also observed in other contexts.
5United Nations Economic and Social Commission for Asia and the
Pacific (ESCAP) (2022). Economic and Social Survey of Asia and the Pacific (2022): Towards post-COVID-19
resilient economies.